Somewhere in nearly every office, every Monday morning, somebody opens a spreadsheet, copies numbers from last week’s export, pastes them into a summary sheet, adjusts a few formulas, makes a chart, and emails it to their manager. It takes an hour, maybe two. It’s mind-numbing, and because it’s done by a tired human, it’s occasionally wrong.
That job is a perfect fit for Python. Spreadsheets are just tables of data, and you’ve already learned how to hold tables of data: lists of dictionaries, back in Chapter 6. This chapter connects that knowledge to the files people actually use, CSV files and Excel workbooks. By the end, you’ll have a program that turns six months of raw sales data into a formatted Excel report, complete with totals and a chart, in about a second. Getting there means learning to read CSV files properly, summarise what’s in them, and write reports, and then to create and update real Excel workbooks with formatting, formulas, and charts.
#Reading CSV files
CSV stands for “comma-separated values,” and it’s the simplest way to store a table. Each line is a row. Within a row, commas separate the columns. The first line usually holds the column names. Figure 15.1 shows a CSV file opened in a text editor and the same file opened in a spreadsheet program.
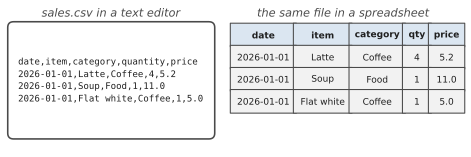
Because it’s plain text, almost every program can read and write CSV: spreadsheets, databases, banking websites, fitness apps. That makes it the universal handshake for moving data around. When a website offers to “export your data,” it very often means a CSV file.
To practise, we need some data. This script creates six months of made-up sales for a small café, just under eight hundred rows. It uses Python’s random module with a fixed seed, which means the “random” numbers come out the same every time it runs, so your results will match the book’s:
1# make_sample_sales.py - create six months of fake café sales
2import csv
3import random
4from datetime import date, timedelta
5from pathlib import Path
6
7random.seed(7)               # same "random" data every time
8MENU = {
9    "Flat white": ("Coffee", 5.0),
10    "Latte": ("Coffee", 5.2),
11    "Croissant": ("Bakery", 4.5),
12    "Banana bread": ("Bakery", 4.0),
13    "Avocado toast": ("Food", 14.0),
14    "Soup": ("Food", 11.0),
15}
16
17out = Path(__file__).parent / "data" / "sales.csv"
18out.parent.mkdir(exist_ok=True)
19
20with open(out, "w", newline="", encoding="utf-8") as file:
21    writer = csv.writer(file)
22    writer.writerow(["date", "item", "category",
23                     "quantity", "price"])
24    day = date(2026, 1, 1)
25    while day.month <= 6:
26        for _ in range(random.randint(3, 6)):
27            item = random.choice(list(MENU))
28            category, price = MENU[item]
29            quantity = random.randint(1, 4)
30            row = [day, item, category, quantity, price]
31            writer.writerow(row)
32        day += timedelta(days=1)
33
34print(f"Wrote {out}")
timedelta(days=1) is a span of time, one day, and adding it to a date gives you the next date. Chapter 18 does much more with this.
You might be tempted to read a CSV file by splitting each line on commas, like we did in Chapter 10. For simple files that works. But real CSV files have traps: a product called Pens, blue has a comma inside it, so programs wrap it in quotes, "Pens, blue", and a naive split breaks it in two. Python’s csv module handles all of that for you, which is why you should always use it.
The friendliest way to read a CSV file is with csv.DictReader. It reads the header line, then gives you each row as a dictionary, with column names as keys:
1import csv
2
3with open("data/sales.csv", newline="", encoding="utf-8") as file:
4    reader = csv.DictReader(file)
5    for row in reader:
6        print(row["date"], row["item"], row["quantity"])
7        break       # just show the first row
2026-01-01 Latte 4
Your rows are now exactly the list-of-dictionaries shape from Chapter 6, and everything you learned there applies. There’s one catch, and it should feel familiar: every value from a CSV file is a string, just like input(). row["quantity"] is the text "2", not the number 2. Convert as you read:
1sales = []
2with open("data/sales.csv", newline="", encoding="utf-8") as file:
3    for row in csv.DictReader(file):
4        row["quantity"] = int(row["quantity"])
5        row["price"] = float(row["price"])
6        row["revenue"] = row["quantity"] * row["price"]
7        sales.append(row)
8
9print(len(sales), "sales loaded")
Adding a calculated revenue column while reading is a handy trick. From here on, every row carries its own revenue, and the rest of the program can just use it.
The reverse trap is just as real: some things that look like numbers shouldn’t be treated as numbers at all. Bilal manages stock for a chain of three pharmacies, and their supplier’s product codes all start with zeros, like 00731. His script converted every column that looked numeric with int(), so 00731 became 731, and when he uploaded his reorder file, the supplier’s system rejected half the lines as unknown products. Phone numbers, postcodes, account numbers and product codes are labels made of digits. You’ll never add them up, so keep them as text.
#Writing reports
Once the data is loaded, summarising it is just loops and dictionaries. Here’s total revenue per month and category:
1from collections import defaultdict
2
3totals = defaultdict(lambda: defaultdict(float))
4for s in sales:
5    month = s["date"][:7]      # "2026-01-15" -> "2026-01"
6    totals[month][s["category"]] += s["revenue"]
7
8for month, cats in totals.items():
9    print(month, {c: round(v, 2) for c, v in cats.items()})
defaultdict comes from the standard collections module. It’s a dictionary that creates a starting value for a missing key automatically, so you don’t need the .get(key, 0) trick from Chapter 6. defaultdict(float) starts every new key at 0.0. The version above is a dictionary of dictionaries: each month gets its own little dictionary of category totals. It looks a bit fearsome, but it simply means “for any month I haven’t seen, start an empty set of category totals.”
s["date"][:7] is a string slice, the first seven characters of the date, which is just the year and month. Dates written as YYYY-MM-DD are wonderful for this, because they also sort correctly as plain text.
To write the summary back out as a CSV file, use csv.writer, which turns lists into properly formatted lines:
1categories = ["Coffee", "Bakery", "Food"]
2path = "summary.csv"
3with open(path, "w", newline="", encoding="utf-8") as file:
4    writer = csv.writer(file)
5    writer.writerow(["month"] + categories + ["total"])
6    for month, cats in sorted(totals.items()):
7        values = [round(cats[c], 2) for c in categories]
8        total = round(sum(values), 2)
9        writer.writerow([month] + values + [total])
Open summary.csv in Excel, Numbers, or Google Sheets, and you’ll see a neat table. There’s also a csv.DictWriter that writes from dictionaries, if your data is already in that shape.
#Automating spreadsheets
CSV is great for moving data around, but it’s plain text. It can’t hold bold headings, column widths, currency formatting, formulas, or charts. For real Excel workbooks, you need a library called openpyxl. It isn’t part of the standard library, so install it first by running this in your terminal:
python -m pip install openpyxl
On macOS and Linux, type python3 instead of python. This is the first time the book has installed something extra, so it’s worth knowing why the command looks the way it does. pip is Python’s installer, and python -m pip means “use the pip that belongs to this Python”. That matters because, as you saw in Chapter 2, a computer can have more than one Python. If you type just pip install, the package can quietly land in a different Python from the one VS Code uses, and your program then fails with ModuleNotFoundError: No module named 'openpyxl' even though the install said it succeeded. Writing python -m pip avoids that whole problem.
Here’s the vocabulary openpyxl uses, which mirrors Excel itself. A workbook is the whole file. It contains one or more worksheets, the tabs along the bottom. Each worksheet is a grid of cells, named by column letter and row number, like A1 or C7.
Creating a workbook from scratch looks like this:
1from openpyxl import Workbook
2from openpyxl.styles import Font
3
4wb = Workbook()
5ws = wb.active                  # the first sheet
6ws.title = "Budget"
7
8ws["A1"] = "Item"
9ws["B1"] = "Cost"
10ws["A1"].font = Font(bold=True)
11ws["B1"].font = Font(bold=True)
12
13ws.append(["Rent", 1800])
14ws.append(["Groceries", 520])
15ws.append(["Transport", 160])
16ws["A5"] = "Total"
17ws["B5"] = "=SUM(B2:B4)"       # a real Excel formula
18
19ws.column_dimensions["A"].width = 14
20wb.save("budget.xlsx")
Open budget.xlsx in Excel and you’ll find a proper spreadsheet, bold headings and all. ws.append() adds a row at the bottom, the same way list.append() adds an item to a list. And notice B5: we stored the text "=SUM(B2:B4)", and because it starts with =, Excel treats it as a formula. Change the rent in Excel and the total updates itself. That’s often better than calculating the total in Python, because the spreadsheet stays “live” for the person using it.
Reading a workbook is just as easy, which is how you automate spreadsheets that other people send you:
1from openpyxl import load_workbook
2
3wb = load_workbook("budget.xlsx")
4ws = wb["Budget"]
5for row in ws.iter_rows(min_row=2, max_row=4, values_only=True):
6    item, cost = row
7    print(f"{item:<12}{cost:>6}")
8
9ws["C1"] = "Per week"
10for r in range(2, 5):
11    ws[f"C{r}"] = f"=B{r}*12/52"
12wb.save("budget.xlsx")
iter_rows(..., values_only=True) gives you each row as a tuple of values, skipping the header with min_row=2. Then we add a new column of formulas and save. That pattern, open a workbook, read it, add or change something, save, covers an astonishing amount of real office work.
One thing to watch out for: when openpyxl loads a workbook, a cell containing a formula gives you the formula text, like =SUM(B2:B4), not the result. Excel calculates results; openpyxl just stores files. If you need calculated values, either do the calculation in Python or open the file with load_workbook(path, data_only=True), which reads the results Excel saved the last time the file was opened there.
#Project: Automated Report Generator
Now let’s build the Monday-morning report. report_generator.py reads the café’s sales, works out monthly revenue by category, finds the best-selling item, and creates an Excel workbook with a formatted summary sheet, live total formulas, a chart, and a second sheet holding all the raw data:
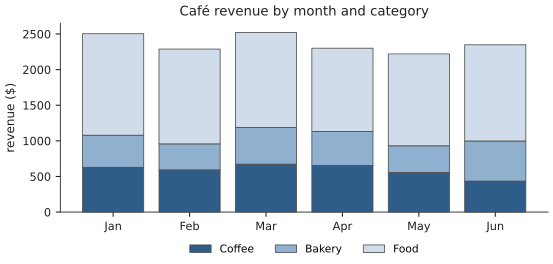
This program has no menu and asks no questions. It runs straight through, which makes it ideal for automating. Figure 15.2 shows its three stages: load the data, calculate the results, and write them out. Most reporting scripts you’ll ever write have this same shape.
1# report_generator.py - turn raw sales into an Excel report
2import csv
3from collections import Counter, defaultdict
4from pathlib import Path
5
6from openpyxl import Workbook
7from openpyxl.chart import BarChart, Reference
8from openpyxl.styles import Font, PatternFill
9
10HERE = Path(__file__).parent
11SALES_FILE = HERE / "data" / "sales.csv"
12REPORT_FILE = HERE / "sales_report.xlsx"
13CATEGORIES = ["Coffee", "Bakery", "Food"]
14MONEY = '"$"#,##0.00'
15
16
17def load_sales(path):
18    sales = []
19    with open(path, newline="", encoding="utf-8") as file:
20        for row in csv.DictReader(file):
21            row["quantity"] = int(row["quantity"])
22            row["price"] = float(row["price"])
23            row["revenue"] = row["quantity"] * row["price"]
24            sales.append(row)
25    return sales
26
27
28def monthly_totals(sales):
29    totals = defaultdict(lambda: defaultdict(float))
30    for s in sales:
31        totals[s["date"][:7]][s["category"]] += s["revenue"]
32    return dict(sorted(totals.items()))
33
34
35def best_seller(sales):
36    counts = Counter()
37    for s in sales:
38        counts[s["item"]] += s["quantity"]
39    return counts.most_common(1)[0]
40
41
42def style_header(ws, row=1):
43    for cell in ws[row]:
44        cell.font = Font(bold=True, color="FFFFFF")
45        cell.fill = PatternFill("solid", fgColor="2F5D8A")
46
47
48def write_summary(wb, totals):
49    ws = wb.active
50    ws.title = "Summary"
51    ws.append(["Month"] + CATEGORIES + ["Total"])
52    style_header(ws)
53    for month, cats in totals.items():
54        r = ws.max_row + 1
55        values = [round(cats[c], 2) for c in CATEGORIES]
56        ws.append([month] + values + [f"=SUM(B{r}:D{r})"])
57    last = ws.max_row
58    sums = [f"=SUM({c}2:{c}{last})" for c in "BCDE"]
59    ws.append(["Total"] + sums)
60    for cell in ws[ws.max_row]:
61        cell.font = Font(bold=True)
62    for row in ws.iter_rows(min_row=2, min_col=2):
63        for cell in row:
64            cell.number_format = MONEY
65    for col in "ABCDE":
66        ws.column_dimensions[col].width = 13
67    return last
68
69
70def add_chart(ws, last_row):
71    chart = BarChart()
72    chart.type = "col"
73    chart.grouping = "stacked"
74    chart.overlap = 100
75    chart.title = "Revenue by month"
76    data = Reference(ws, min_col=2, max_col=4, min_row=1,
77                     max_row=last_row)
78    months = Reference(ws, min_col=1, min_row=2, max_row=last_row)
79    chart.add_data(data, titles_from_data=True)
80    chart.set_categories(months)
81    ws.add_chart(chart, "G2")
82
83
84def write_raw_data(wb, sales):
85    ws = wb.create_sheet("Raw data")
86    columns = ["date", "item", "category", "quantity", "price",
87               "revenue"]
88    ws.append(columns)
89    style_header(ws)
90    for s in sales:
91        ws.append([s[c] for c in columns])
92    ws.freeze_panes = "A2"        # keep the header visible
93
94
95def main():
96    sales = load_sales(SALES_FILE)
97    totals = monthly_totals(sales)
98    item, quantity = best_seller(sales)
99
100    wb = Workbook()
101    last_row = write_summary(wb, totals)
102    add_chart(wb["Summary"], last_row)
103    write_raw_data(wb, sales)
104    wb.save(REPORT_FILE)
105
106    grand = sum(s["revenue"] for s in sales)
107    print(f"Read {len(sales)} sales across {len(totals)} months.")
108    print(f"Total revenue: ${grand:,.2f}")
109    print(f"Best seller: {item} ({quantity} sold)")
110    print(f"Report saved to {REPORT_FILE.name}")
111
112
113if __name__ == "__main__":
114    main()
As usual, read it in pieces. load_sales() reads the CSV and converts types, in one place. monthly_totals() and best_seller() do pure calculation. The write_... and add_chart functions deal with Excel. And main() tells the story. If your manager asks for weekly instead of monthly totals, you change one function.
Counter, also from collections, is a dictionary built for counting, and its most_common(1) method returns the top item and its count. PatternFill gives a cell a background colour, written as a hex code like the ones used on web pages. number_format uses Excel’s own format codes, so '"$"#,##0.00' shows money with a dollar sign, thousands separators, and two decimal places. ws.max_row is the number of the last row that has anything in it, which is how each new row knows its own row number for the =SUM formula. And freeze_panes = "A2" keeps the header row visible while you scroll through eight hundred rows of raw data, a small touch that people appreciate.
The chart code describes the chart rather than drawing it. A Reference points at a range of cells, the same way you’d select them with a mouse. We tell the chart where the data is and where the labels are, and Excel draws it when the file is opened. Because it’s a real Excel chart, it updates if someone edits the numbers.
Run make_sample_sales.py once, then the report:
Read 792 sales across 6 months.
Total revenue: $14,186.40
Best seller: Flat white (368 sold)
Report saved to sales_report.xlsx
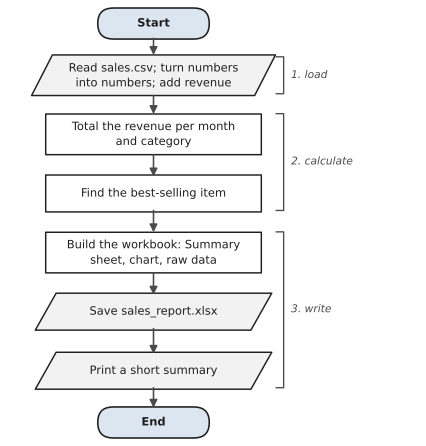
Open sales_report.xlsx and you’ll find the summary sheet with its stacked column chart, matching the picture in Figure 15.3, plus a second tab with every sale.
An hour of Monday-morning copying and pasting, done in under a second, the same way every time, with no typos. And next Monday you just run it again. Some ideas to extend it:
- Add a third sheet that lists each item with its total quantity and revenue, sorted from best to worst.
- Highlight any month whose total is lower than the month before, by giving that row a pale red
PatternFill. - Let the report take the CSV file name from
sys.argv, as the organizer did in Chapter 14, so it works on any sales export.
CSV files are tidy: every value sits in its own column, waiting to be read. A lot of useful data isn’t like that. It’s buried in emails, notes, log files and documents, as dates and amounts and phone numbers scattered through ordinary sentences. In the next chapter you’ll learn a tool built for exactly that job, regular expressions, which let you describe the shape of what you’re looking for and find every match in seconds.
#On the Job
How it shows up at work: This is probably the most directly employable chapter in the book. Spreadsheets run offices, and “can you automate the weekly report?” is one of the most common first requests anyone with Python skills receives, whether their job title says developer, analyst, administrator or accountant. Data analysts spend much of their week reading exports, cleaning them, summarising them and producing workbooks people can open.
What employers expect: Read and write CSV with the csv module (never by splitting on commas), convert types deliberately in one place, and summarise with dictionaries. Produce Excel files that look professional: bold headers, sensible column widths, number formats. Know that pandas exists, and that it’s the next step for bigger data work; Chapter 30 points you to it.
Interview questions you might meet:
- “Why not just split each line on commas?” Because values can contain commas inside quotes, like
"Pens, blue". Thecsvmodule handles quoting properly. - “Why do you need
newline=""when opening a CSV file?” It stops Python changing line endings, which would otherwise give you blank rows between lines on Windows. - “A column of product codes lost its leading zeros. What happened?” Something treated them as numbers. Keep codes as text. Bilal’s story is a good answer, and Excel itself does this too when you open a CSV by double-clicking.
- “How would you total sales by month?” Loop over the rows, take
date[:7]as the key, and add to a dictionary. Exercise 15.6 does exactly this.
Portfolio task: Push the report generator with one of the suggested extensions, plus the sample-data script, so anyone can reproduce your report. Add a screenshot of the finished Excel file to the README; for a data project, a picture of the output is worth more than any description.
Professional habit: Before writing any report code, open the data and check three things: what’s in each column, whether any values are missing, and which columns are really numbers. Five minutes of looking saves an afternoon of puzzling over wrong totals.
#Exercises
Solutions are in solutions/chapter_15 in the book’s GitHub repository, along with sales.csv, the same six months of café sales used in this chapter. The Excel exercises need openpyxl installed.
Warm-up
Exercise 15.1. Read sales.csv and print the first five rows, then the total number of rows.
Exercise 15.2. Print the names of the columns in sales.csv. (DictReader has a fieldnames attribute.)
Exercise 15.3. Write a CSV file called friends.csv with columns name, city and phone, and three rows of made-up friends. Make one city Washington, D.C. and check that it’s still one value when you read the file back. Keep the phone numbers as text.
Practice
Exercise 15.4. Work out the total revenue in sales.csv (quantity times price for every row), to two decimal places.
Exercise 15.5. Total the quantity sold for each item, and print the items from best-selling to worst.
Exercise 15.6. Total the revenue for each month. Print a little table with the month (like 2026-03) and the revenue.
Exercise 15.7. Find the single best day, the date with the highest total revenue, and print it with its revenue.
Exercise 15.8. Write a new CSV file, big_orders.csv, containing only the rows where the quantity is 4, with an extra revenue column.
Exercise 15.9. Bilal’s trap. Here’s a small stock file. Read it and write a reorder file for every product with fewer than 10 in stock, keeping the product codes exactly as they were:
code,name,in_stock
00731,Paracetamol 500mg,4
01022,Bandages,25
00045,Sunscreen SPF50,7
10370,Cough syrup,12
Challenge
Exercise 15.10. Create an Excel workbook with one sheet per category (Coffee, Bakery, Food). Each sheet lists that category’s items with their total quantity and revenue, with a bold header row and a total row at the bottom.
Exercise 15.11. Open the workbook from Exercise 15.10 with load_workbook, add a sheet called Summary that lists each category and its revenue, and save it under a new name.
Exercise 15.12. Find days with suspicious data: any day whose revenue is less than half the average daily revenue. Write them to a CSV file with the date and revenue, so a manager can check them.
Exercise 15.13. Write a function clean_amount(text) that turns messy money values like "$1,234.50", " 99 ", and "12.5 AUD" into floats, and returns None for values like "n/a" or blank. Test it on a list of examples. (In the next chapter, you’ll see a neater way to do this with regular expressions.)